The Hypocrisy of the Rent Control Debate
And a deep dive into the core explanation and the justifications for Rent Control and its hypocrisy
The current mainstream perspective on rent controls, at least among our ruling class, is that rent control is bad and not to be done due to the fact that rent control decreases supply. This is even despite the fact that 3 in 4 people in Australia support rent control. The previous Labor housing minister – Julie Collins – has claimed “…overall the evidence and data shows it (rent controls) doesn’t work long-term. What it shows long term, in terms of what the experts are telling us, is that it reduces supply….” Similarly the Coalition echoes this stating “(rent controls)…negatively affects the quality of rental stock (…) a reduction in rental supply and increase rental costs in the long term.”
Putting aside the actual veracity of the claims about rent controls’ effect on housing (it is a lot more debatable than presented) the discussion uses dishonest framing of rent control or no rent control being the only policy options. You can actually build public housing while still having rent control. This isn’t even unprecedented; while Robert Menzies was Prime Minister, Australia saw a rapidly increasing housing supply while also having rent controls across the country. It is frankly a complete lie to frame the rent control debate as both sides of the Australian Parliament does. We will put this aside to avoid becoming mired in a discussion and debate around the empirical data and quality there of in economics. Instead I want to take a look at the core of the theory of why rent control doesn’t work.
But the worst of this is the two-faced double standard this debate suffers. There is a standard of “economics” used when discussing (relatively) costless government interventions, and then a completely different standard when talking about subsidies. To see this, we must take a look at the origins of the presented arguments against rent control. At its core the argument comes down to a simple graph.
A graph.
At its core, the arguments about rent control are based on and evolve from a single graph. Excuse the tangent into economics but it is important, and will serve you well if you ever come across some of these economics types.
While there is evidence and arguments, the rent control argument and discussion was informed by a graph first, and then evidence was gathered to align with the graph after.
This is the graph that “Debunks” rent control:
So what does this chart actually mean? Let’s take a tangent into basic economics to explain it. Feel free to skip this next section if you are already familiar with the economics of this graph.
A tangent into some basic “economics”.
So let’s start with the first thing first. Economics makes a lot of assumptions. It is built off a tradition of making simplifications and assumptions. This can kind of work, but does cause a lot of issues; I will be trying my best to not go into tangents and will potentially do a follow up post highlighting the issues with this graph and economics as a whole; But for now, I just want to look at the argument our politicians are making against something that the vast majority of Australians are for.
So starting with the first two biggest lines on this graph, Supply and demand.

Supply is the line illustrated in red. What this represents is how much suppliers are providing to the market. The supply and demand model is very much based on more basic local, discretionary good markets. So think of apples. If there is a higher price of apples, it means more producers can enter the market, and therefore provide a larger quantity of goods to the market. Simplifying this phenomenon down creates this red line known as a supply curve, and the curve upwards trends. In traditional good markets, if a price is too low, supply decreases as suppliers will drop out of the market as they can’t “afford” to provide the goods due to having too high overhead for such good procurement/production.
This is of course not how the rental market works. But this graph ignores that. It also ignores how rentals are a “consumption contract” compared to other goods which caused the creation of this graph. But it mostly ignores this as well.
So, based on these (made up) numbers, if the going rate for an apartment is $700, then the suppliers will provide 2,200,000 of them to the market. This is of course a super large simplification of how suppliers in the market works, especially in the rental market space. But moving on:
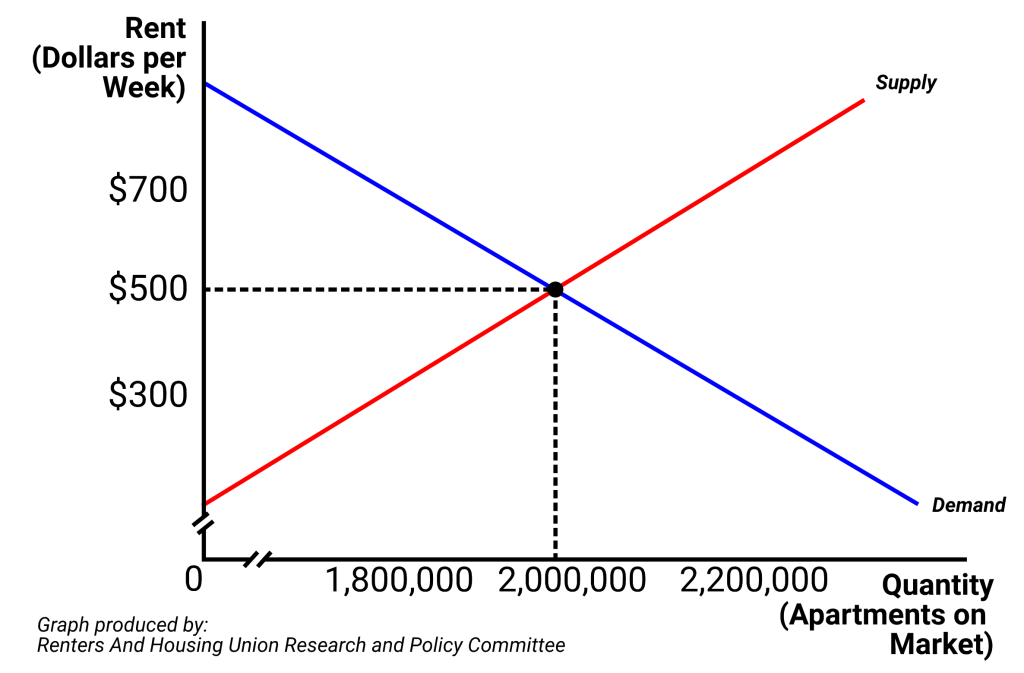
Demand is the line illustrated in Blue. What this represents is the demand of consumers of a good or service. In our example it represents renters or tenants. What each point represents along the line is the number of tenants demanding apartments at a certain price point. This is downward trending; aAs price decreases, demand will increase as larger and larger quantities of the good/service is able to be purchased by larger amounts of people who can afford it. When the price is higher, demand decreases due to less tenants being able to afford the apartments, and having to either delay moving out of their parents home (or even never move out), live more densely and/or be kicked out and made homeless.
This is the demand curve.
Where these two curves (supply and demand) intersect is at a rent of $500 a week, where 2 million apartments are provided to the market.
This point is known as the “equilibrium.” Markets take time to reach equilibrium levels and it is basically agreed by all economists that markets in real life almost never are at this equilibrium level (it is also almost impossible to calculate an objective equilibrium for IRL markets).
Okay so that is the fundamental basics of Supply and Demand covered. Let’s look at how rent control applies to this graph.
Putting in Rent Controls and their costs
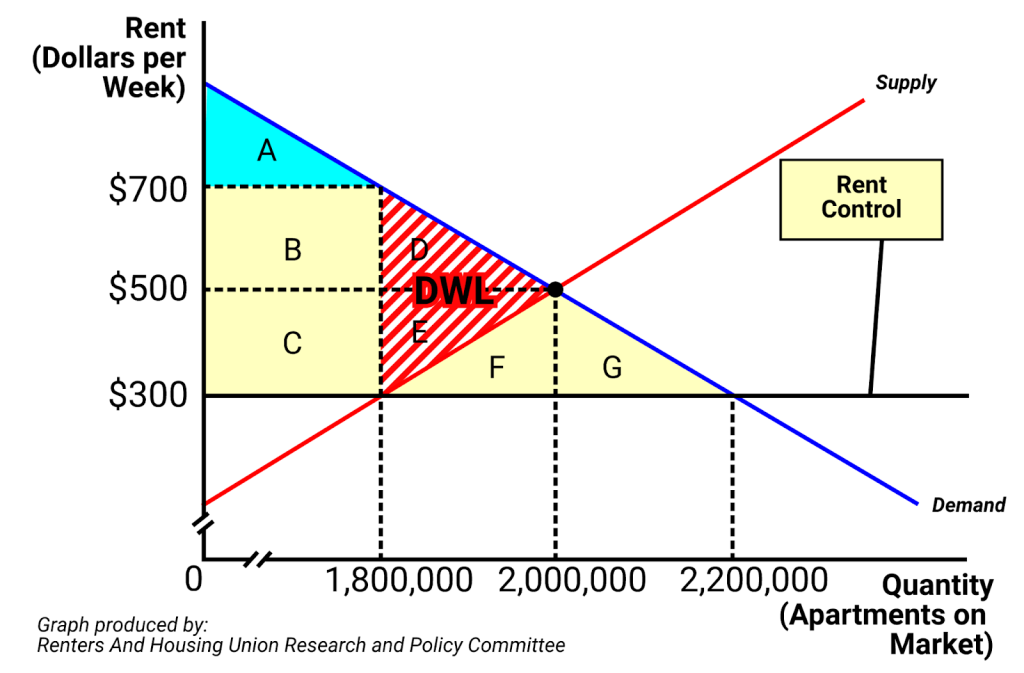
So, let’s imagine rent control is implemented in this apartment market. This is forced by the government, and rents are now set to a maximum of $300 a week (in reality such a control like this is never this simple, but again, economics simplifies this). This results in the Graph. The Rent Control here sets what is known as a “price ceiling.”

Economists will say something like “this sounds good in theory…” and then explain why we just have to kill all the poors or whatever.
That does happen here. While it does lead to a lower rent, it doesn’t account for “the market” (that is basically arbitrarily made up for the graph). So while rent is limited to $300/week, the (made up) suppliers of rentals can only provide 1.8 Million units to the market. Meanwhile, at a price of $300/week, 2.2 Million tenants can afford apartments at that price. We can see a gap in supply of 400k units, this causes a shortage.
Now to get to illustrating the “cost” of rent control.
We will be assuming the market was in equilibrium pre-rent control.
The consumer surplus is the extra money consumers have since rentals are cheaper than what the maximum they can afford. Think of it like, you can only afford to pay for a rental up to $300 a week, but if you find a rental for $200 a week, you get an extra, or a surplus, of $100 a week. This total extra/surplus of money across all consumers, is represented by A, B and C.
Meanwhile, the Supplier Surplus, which is the same as the consumer surplus but for suppliers, is represented by all the areas below equilibrium but above the red line, which includes areas C and E.
However, under a rent controlled market, these surpluses changed. The consumers are supposed to increase their surplus to include the areas of C and E from suppliers, and have F and G added. However, due to the supply limitations consumers only gain the area C, and lose D. Meanwhile, Suppliers lose C and E.
This leads to an area of the graph where D and E are completely lost as surpluses. And this is known as the “Dead Weight Loss” (DWL). What the DWL represents is the loss to society of money that could be used by consumers or suppliers to go into the economy (consumers by assuming they are spending more and suppliers by assuming using the extra money or profit to build more). But money does not exist due to the dead weight loss. This also assumes that a consumer surplus and a supplier surplus are equally valuable to the economy.
As a bit of a tangent: widespread misinterpretations of this graph lead to an added idea that only tenants/consumers from point i to ii along the demand curve end up in rentals (this was actually what I was taught in university economics). The implications being that only the already richest renters (those with the highest surpluses) benefit from rent controls and actually get the rentals and the extra surplus. While this may or may not be true in reality; The graph itself does not actually imply this. The intercept at ii is related to the supply curve, and its intercept on the demand curve doesn’t represent anything. In reality the people in the rentals would be 1.8 Million, but these people would be randomly distributed across the curve from points i to iii. Meaning that there is potential that people who couldn’t afford at equilibrium are then able to afford it during rent control.
But what the graph mainly suggests is the better thing to do is in fact increasing supply, not doing rent controls.
The hypocritical core
So that is essentially the basis as to why politicians oppose rent controls. They argue that this graph is correct and essentially aligns with reality (despite the many assumptions that are made here). Putting aside the issues with the graph – there is an underlying logic to the graph. The implications of the graph is why so many politicians mention supply when talking about the housing crisis. But what do they propose instead?
At the last election the current government party went to the polls with its flagship housing policy. The policy was that the government would subsidise 15% of a 20% home deposit, meaning consumers would only need to save up 5% of a deposit to afford a house. But hang on a second. This is essentially a subsidy. Labor also often touts their increases to rent assistance, which is definitionally a subsidy.
The Coalition’s (or just Liberals now?) “flagship” housing policy policy at the last election was “The Coalition would let first home buyers deduct a portion of their repayments from their taxable income if they buy a newly built home.” according to The Guardian. While technically not a direct payment, this is essentially a subsidy in an accounting sense of lost tax income (a comically unfair subsidy aimed at only benefiting the richest who earn the highest taxable income).
So both parties prefer subsidies over Rent Controls. But hang on….What happens to the housing market if we put this subsidy on it? Does the graph suggest that subsidies are much better?
Subsidies are also bad btw
In this graph – that is an extremely simplified representation of the housing market – the subsidy is an exaggeration, but totals to essentially $400k per home buy (900k-500k). Assuming the market reaches equilibrium (which wouldn’t happen instantly, it takes a while) the subsidy does not make houses 400k cheaper, but in fact half that, only making home buyers pay 500k instead of 700k, while builders can charge an extra 200k. At least according to the graphtm.
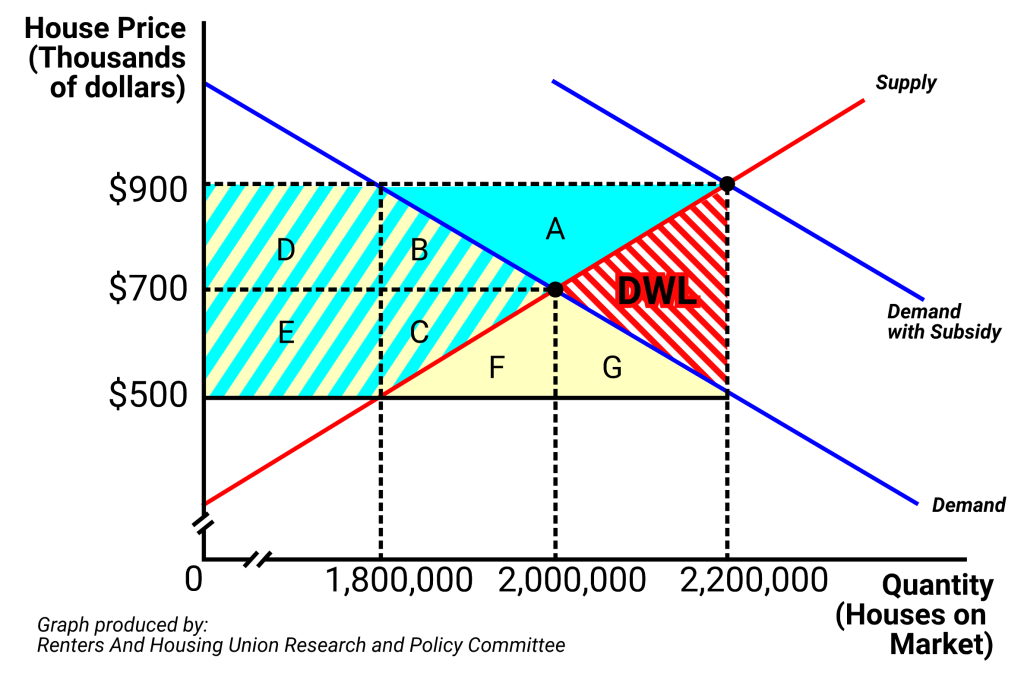
When it reaches the new equilibrium (something that won’t happen instantly but let’s ignore that) it does lead to increased surpluses for both the consumer and the producer. The Consumer gains the areas E, C, F and E as a surplus, while the producer gains A, B and D as a surplus.
But it is a subsidy. Meaning the government has to pay for it. So the total cost of the subsidy is the area of A + B + C + F + G and DWL1. But, there is more money going in than the gains in surplus, which leads to a “Dead Weight Loss” the size of the area “DWL”. Notice it’s the same size as an equivalent rent control policy.
The difference between a subsidy and a price control is A) It costs the government money directly instead of imposing it indirectly on society, and B) It increases the surpluses overall for both buyers and sellers, instead of the transfer of surplus from sellers to buyers as takes place with rent control.
In this simplified model, the increase in surplus is far greater than when compared to the equivalent Dead Weight Loss caused by price ceiling/rent control. But, this is before accounting for the “trade off” of putting tax dollars towards these subsidies instead of being used elsewhere where the spending would far better increase welfare for society instead of into the pockets of landlords.
Why?
Now is this a gross simplification of both parties’ policies, and ignoring a lot of real world context? Absolutely! But this simplification and ignorance is no greater than what both these parties do in the face of demands for Rent Control.
The fact is that ruling politicians follow a rigorous economic orthodoxy when talking about the rental market, but as soon as the owners housing market comes into the picture, they suddenly forget to follow such a strong commitment to economic orthodoxy.
But why?
It is partly, they would rather policies that subsidise capital and investors, and policies that keep this unsustainable housing market going. Rent control is the epitome of what they do not want. A transfer of surplus from landlords to the renters. They would much rather waste taxpayer money making sure the landlords have more money then spending nothing to improve the conditions of renters. If improvements are made to those at the lowest end of the market via anything that isn’t subsidies, it would mean less profits of landlords, property investors and real estate agents. And of course our parliament could never compromise thy holiness property sector profits.
But the largest reason is: neither party really needs to care about renters, and they don’t have a reason to. Renters represent the minority of the poorest of Australians. Renters only represent 1/3rd of households. Of the 150 seat parliament that decides who governs Australia, only 5 of those seats are made up of majority renters. Liberals won’t get votes from “conscious” renters (in the class conscious sense of the word) anyway, and renter votes flow to Labor in the end regardless of what Labor actually does. Neither major party really has any incentive to focus on renters. This was illustrated quite well by Labor’s “Flagship housing policy” not including a single policy to help renters.
The double standard exists because property owners have the power, while renters don’t. Property owners can decide elections, but renters don’t. Both parties would quickly change their tune about rent controls if forced to, and if renters were powerful enough to demand it from them. This has happened before. Again it was successive Labor and Liberal governments that had rent controls in the middle to late 20th century. That was the time where renters and working people had real collective power via their unions.
In 2025 such collective power still simmers under the surface, but the lack of organisation and direction of power means it remains impotent.
Overall
While there is the debate to have about it, the current argument of Rent Control is riddled with hypocrisy and false dichotomies. I hope that I was able to enlighten one as to where these arguments are coming from. And also, why they are so flawed.
If interest exists I will do a follow up article ripping apart and explaining the issue with applying the simple model of a supply and demand graph to the rental and housing market.
Renters cannot depend on virtue signalling of politicians. We are an economic minority, and the calculus of parliamentary power means there is little that will be done for renters in the short term while we remain a minority. The only way forward is to fight. We must fight for freedom from exploitation via struggle and militant union actions as a collective. That is why RAHU exists, and why we need to struggle.
In Solidarity,
William “Schmilly”,
Research and Policy Officer, Renters And Housing Union.
Post Scriptum
Thank you for taking the time to read the article all the way through. If anyone is interested in an article ripping apart the graph itself presented here please let me know and I can put something together.
- Can actually be calculated! With (2.2M-1.8M) X (900k-500k) = $160 Billion would be the cost of policy in the hypothetical market. ↩︎